
A graph plotted with time along the X-axis and the velocity along the Y-axis is called the velocity-time graph. The nature of the graph depends on the nature of the motion of the particle. The velocity-time graph for different cases is explained below.
Contents
Velocity time graph for uniform motion
In uniform motion, the velocity of the particle remains the same. For a particle moving with uniform velocity, the graph is a straight line (AB) parallel to the time axis (X-axis) as shown in figure 1.
Similarly, if the particle moves with a uniform negative velocity, the velocity-time graph will be a straight line below the time axis.
What does the area under a velocity graph represent?
The velocity-time graph enables one to calculate the total displacement of the particle in a time interval. The area under the velocity-time graph between the time t1 and t2 (shaded portion ) gives the displacement during the time interval t1 to t2 (figure 2).
Proof:
Let A and B be two points on the velocity-time graph corresponding to instants t1 and t2.
Then v = CA = DB and
t1 = OC, t2 = OD
The displacement of the particle in the time interval (t2 –t1) = velocity × time interval
i.e., v × (t2 – t1) = CA × (OD –OC) = CA × CD
ie., Displacement = Area under ACDB
This means that the displacement of an object in the time interval (t2 – t1) is numerically equal to the area under the velocity-time graph between instants t1 and t2.
i.e, Area under the velocity-time graph of a particle will give the displacement of the body during that time interval.
You can also go through my previous article which discussed the meaning and shape of the position-time graph for uniform motion.
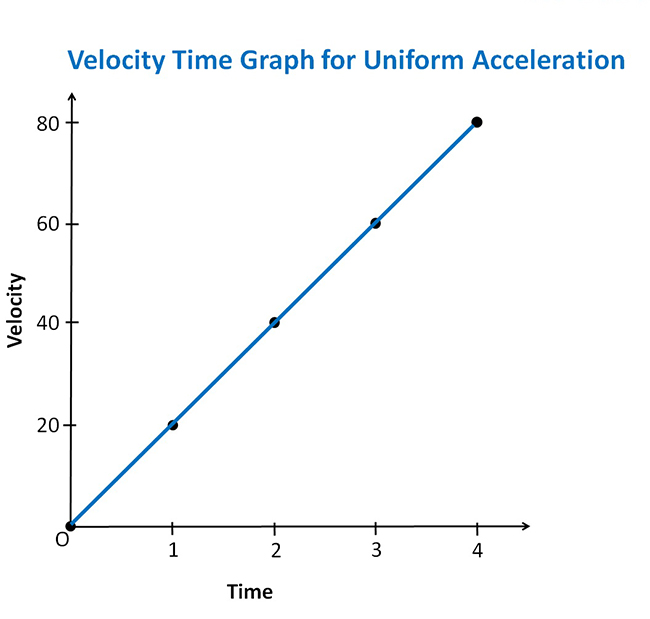
Velocity-Time graph for uniformly accelerated motion

If the particle starts from rest and experiences uniform acceleration, the velocity-time graph will be a straight line passing through the origin and having a positive slope (as shown in figure 3)
If the particle has an initial velocity the graph will be a straight line, but will not pass through the origin as shown in figure 4.
In figure 4, the ordinate OA gives the initial velocity and the ordinate BD gives the final velocity.
The velocity-time graph of a particle moving along a straight line with uniform acceleration may be used to measure the displacement of the particle and also the acceleration.
A) Area under the velocity-time graph gives the displacement
The area under the velocity-time graph gives the total displacement of the particle during the time interval.
Consider a particle moving along a straight line with uniform acceleration a. Let v0 be the velocity of the particle at the instant t = 0 and vt at a later instant t. The velocity-time graph of such a motion is as shown in figure 5.
The area under velocity time graph during the interval 0 to t is ABDO.
-----------(1) \But;we;know,&;acceleration,;a=left ( frac{v_{t}-v_{0}}{t} right ) \&ie.,;left ( v_{t}-v_{0} right )=at \Substituting;∈(1),\;Area,;ABDO&=v_{0}t+frac{1}{2}tleft ( at right ) \&=v_{0}t+frac{1}{2}at^{2} \&= the;displacement \therefore Area;ABDO&=displacement;during;the;time;interval;0;to;t. end{aligned}")
Thus area under the v-t graph gives the displacement of the particle in that given time interval.
B) Slope of a velocity-time graph gives acceleration
The slope of the velocity-time graph gives the acceleration of the particle.
Similarly, as said earlier, for a particle moving along a straight line with constant acceleration, the velocity-time graph will be a straight line inclined to the time axis as shown in figure 6. Let v0 be the velocity at t = 0 and vt be the velocity after a time interval t.


That is, the slope of the velocity-time graph gives the acceleration of the particle.
Velocity-Time graph for uniform retardation
For a particle moving with uniform retardation or deceleration, the velocity-time graph will be a straight line having a negative slope (as shown in figure 7). If the body is brought to rest, the graph will touch the time axis.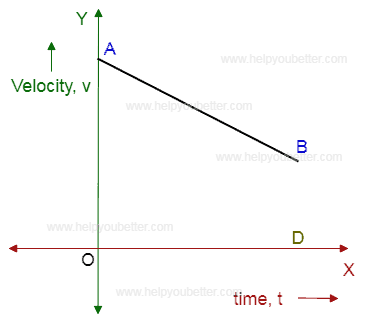
Velocity-Time graph for non-uniform motion
In the case of a particle moving with variable velocity, the velocity-time curve will be irregular in shape.
For example, consider a car starting from point A. Let it be moving along a straight line with uniform acceleration a during the time interval t1 to t2 and then start moving with uniform velocity during the interval of time t2 to t3. Thereafter, let the velocity of the car decrease uniformly and the car come to a stop at the instant t4. The motion of the car can be represented by the v-t graph, as shown in figure 7. Then the area under the velocity-time graph gives the total displacement of the car.
You can also go through my previous article which discussed the meaning and shape of the position-time graph for non-uniform motion.
Uses of the velocity-time graph
- To find the velocity of the particle at any instant.
- To find the displacement of the particle in a given interval of time. The displacement is numerically equal to the area enclosed by the velocity-time graph, the time axis and the ordinates at the beginning and at the end of the interval.
- To find the acceleration of the particle moving with uniform acceleration. For a particle moving with uniform acceleration, the velocity-time graph is a straight line. The slope of the line gives the acceleration of the particle.
I hope the information in this article helps you to get a brief idea regarding the concept and different shapes of velocity-time graphs. Also, this article explored the methods to find the displacement and acceleration from the v-t graph.
Also, share your feedback about this article as well as your thoughts on any other information which might be useful to the topic of velocity-time graphs.
Also learn, How to draw a velocity-time graph from a position-time graph?
| RELATED ARTICLES | |
| Understand the meaning of different shapes of a position-time graph. | How do you express instantaneous velocity of a body in non-uniform motion along a straight line? |
| Obtain the general equations of motion. | Problems and examples related to the three equations of motion. |
| Write the difference between distance and displacement in tabular form. | Explain the different rules for significant figures. |